Table of Contents
Reports and Graphs
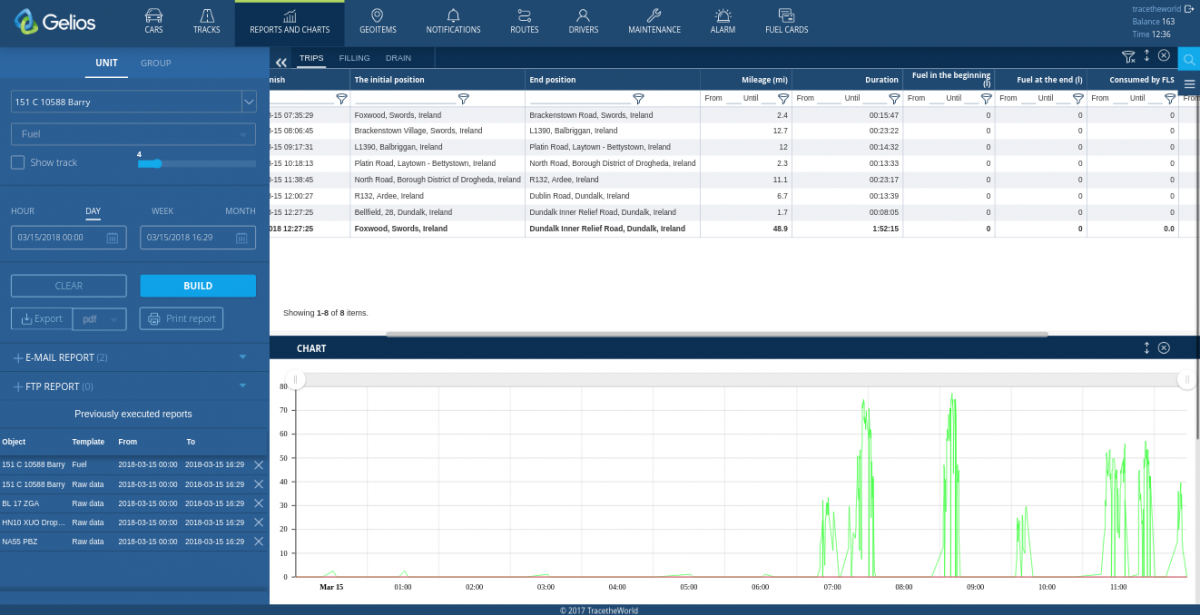
Being a monitoring system, Gelios allows you to generate an extensive set of reports under pre-set parameters. Reports can be used to justify the drivers’ wages formation, fuel consumption accounting and other operations related to accounting. Following a comparative analysis of the data provided by such independent sources as the driver’s verbal report and system readings, it is possible to prevent and suppress violations by dishonest employees. Reports on the activity of an unit can be presented in the form of tables and graphs. They can be viewed in a browser window, as well as exported to files of various formats.
The following functions are available on the Reports and Graphs tab:
- Generate a report for a separate unit;
- Generate a report for a group of units;
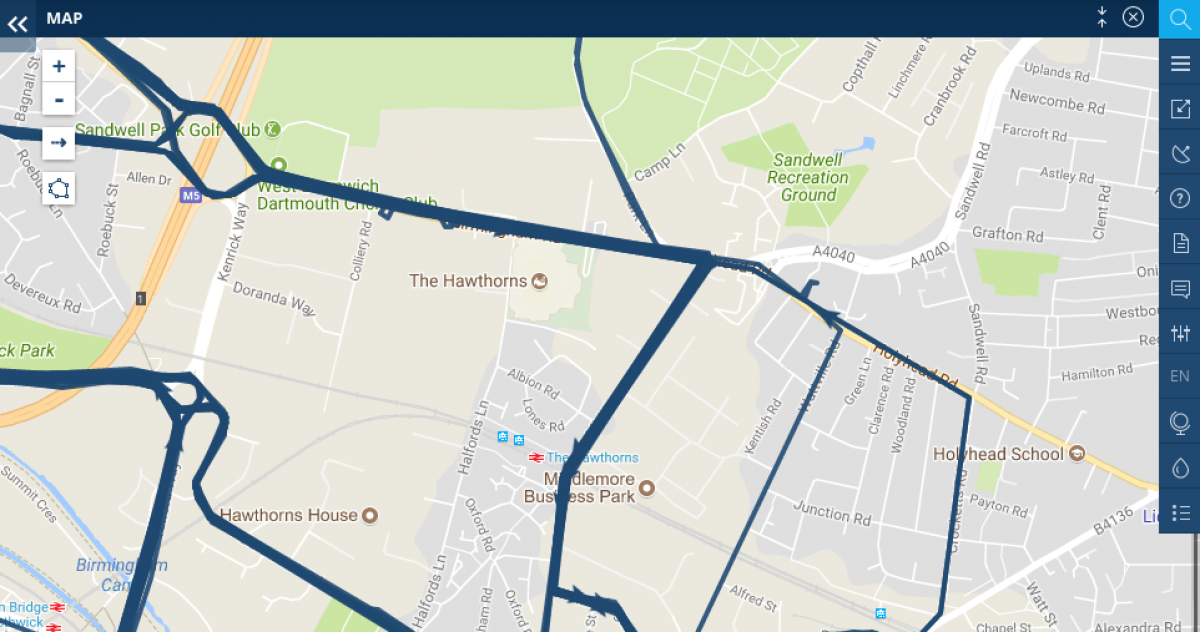
- “Show the track on the map” (Display the track of the unit(s));
- Adjust the thickness of the track line on the map;
- Select the time interval for the report (Attention! The data on paid units are stored for 13 months, with 30 days on free units and the reporting period for the free unit being 1 day);
- Export reports in PDF, XLSX, HTML and print them;
- Set up periodic reporting;
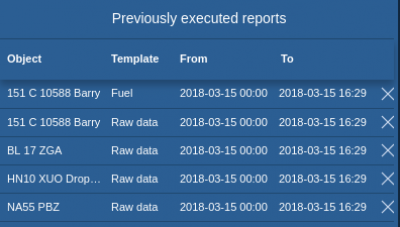
- Archive of previously submitted reports.
Report generation
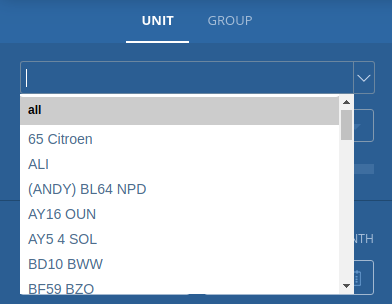
Reports are generated for a separate unit or for a group of units. To select, click on the required tab and select an unit or group of units from the drop-down list, respectively.
The report is selected from the drop-down list. Reports from the Shared Templates group are reports that are available in Gelios by default.
To generate a report, you need to specify a time interval. Standard intervals of the system are:
- Last hour;
- Last day (by default);
- Last week;
- Last month.
| Important! Reports for free units can be made within 24 hours. |
It is also possible to select an arbitrary time interval with the use of a calendar.
The report is generated by clicking the Generate button. An example and description of the generated report is given in the subsection of the report window.
Click the Clear button to clear all the specified values.
In case of a report on geozones, an additional form for geozone/geozone group selection is displayed below the template. You can select a report template by route in the same way. You need to specify all required routes in the input box (it is possible to specify more than one route).
Export
To export the generated report, select the file format with the data to be uploaded. The following formats are available:
- PDF;
- XLSX;
- HTML;
- CSV;
- XML.
After selecting the file format, click the Export button. As a result, the file of the selected format is created and then downloaded to the download directory specified in the user’s current browser.
If necessary, the report can be immediately sent to print, which is why the Print report button is provided. In the opened window in the left part, there is a list of available tables, which can be excluded from printing if necessary.
Periodic reporting
Gelios allows you to automatically generate certain reports on units or groups of units with the subsequent sending to the specified address and configure the sending at the specified time.
There are two ways to send reports:
- E-mail;
- FTP.
To configure the sending, click ![]() opposite the desired sending method and fill in the form fields.
opposite the desired sending method and fill in the form fields.
In the opened window, you need to select on which unit or group of units the report will be executed. Next, the fields are filled in:
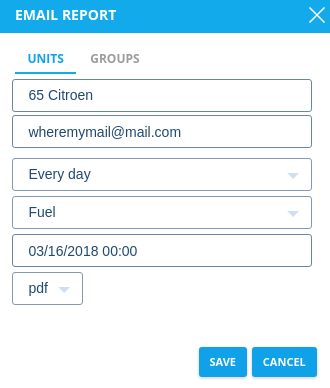
For sending via E-mail, you must specify:
- E-mail to which the report will be sent;
- Frequency (every day, once a week, every two weeks, once a month);
- Report to be executed;
- Date and time when the report will be executed and sent;
- File format — PDF, XLSX.
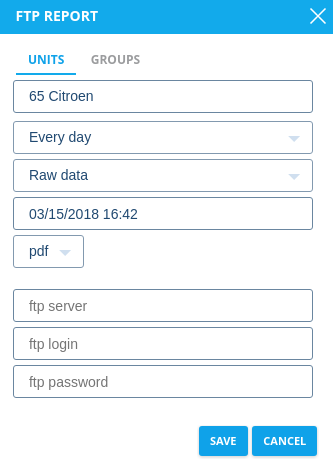
For sending via FTP, you need to specify:
- unit or group of units;
- report delivery period;
- report name;
- date and time of the report sending;
- format of the report file;
- FTP server address, user login and password.
In such a manner, you can configure more than one report sending by each method. Customized sendings are displayed in the list and are editable. When the mouse is moved over the report name, additional delivery information is displayed on the screen.
Report history
The archive stores versions of previously executed reports. In case you need to download a report that was executed earlier, you can download it from the archive, which will save considerable time for its execution.
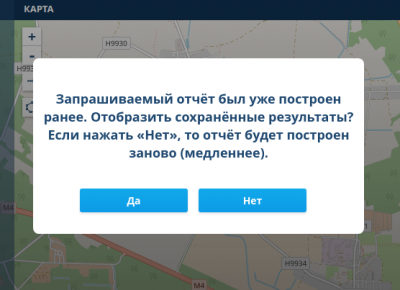
If some data changes, the system checks to see if the report exists in its memory and prompts you to choose whether to run the report or download it from memory. The changed data may be regarded as changing the settings of units, sensors, etc.
If you click Yes, the report will be downloaded from the archive, if No — the report will be regenerated.
Report window
The information on the unit/group of units available in the database is presented in the form of tables. The top of the window is the window masthead, which contains logics included in the report. Also, there are window controls (hide/show filters, maximize the window, minimize the window). When you click on the entry line, the map is focused (if possible) on the selected interval.
Each column of the report contains a filter that allows you to flexibly configure the display of the received data. To do this, place the cursor in the appropriate field and enter a value or range of values, depending on the type of data in the current column. To apply the filter, click on the icon
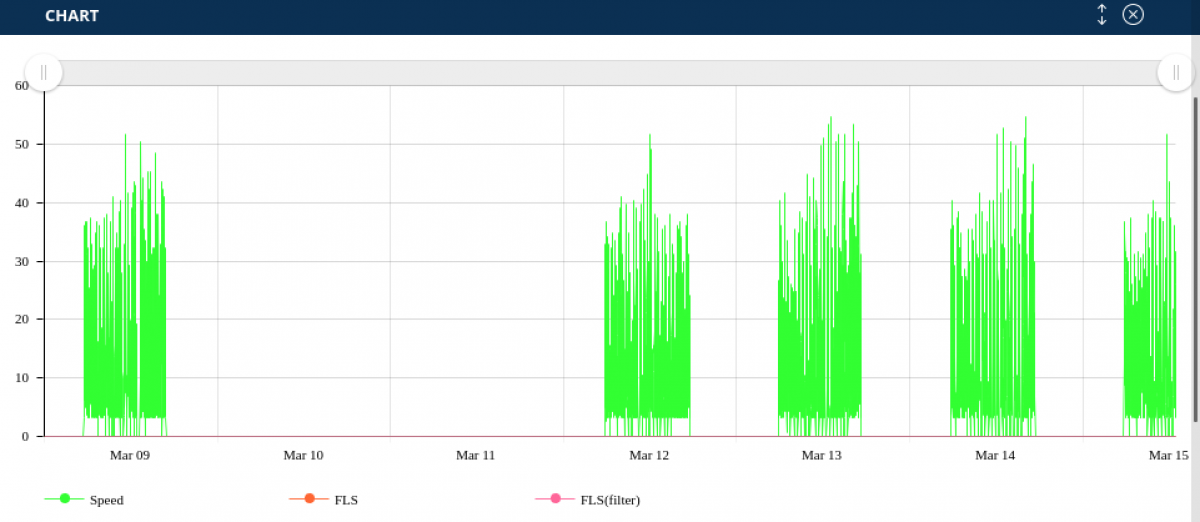
Graph
This window is available in reports where graphs are created. When the mouse is moved over the graph, the information is displayed in this message. When you press the cursor on the graph and move it for some distance, the selected area will be highlighted and the graph will automatically focus on it. Besides, you can disable graphic elements in the marginal notes.
