GeliosMobile Guide for iOS
Contents
1. System Requirements
The app is designed for users of smartphones with operating systems:
- iOS (version 8.0 or later);
- Android (version 4.2 or later).
2. Account Login
After running the app enter the Login and Password of your account in Gelios Tracking System.
3. Overview of the GeliosMobile App Interface
The app is conditionally divided into 3 screens: Map, Analytics, Settings. Please, first of all, read the settings of the app for more convenient using.
3.1. Settings
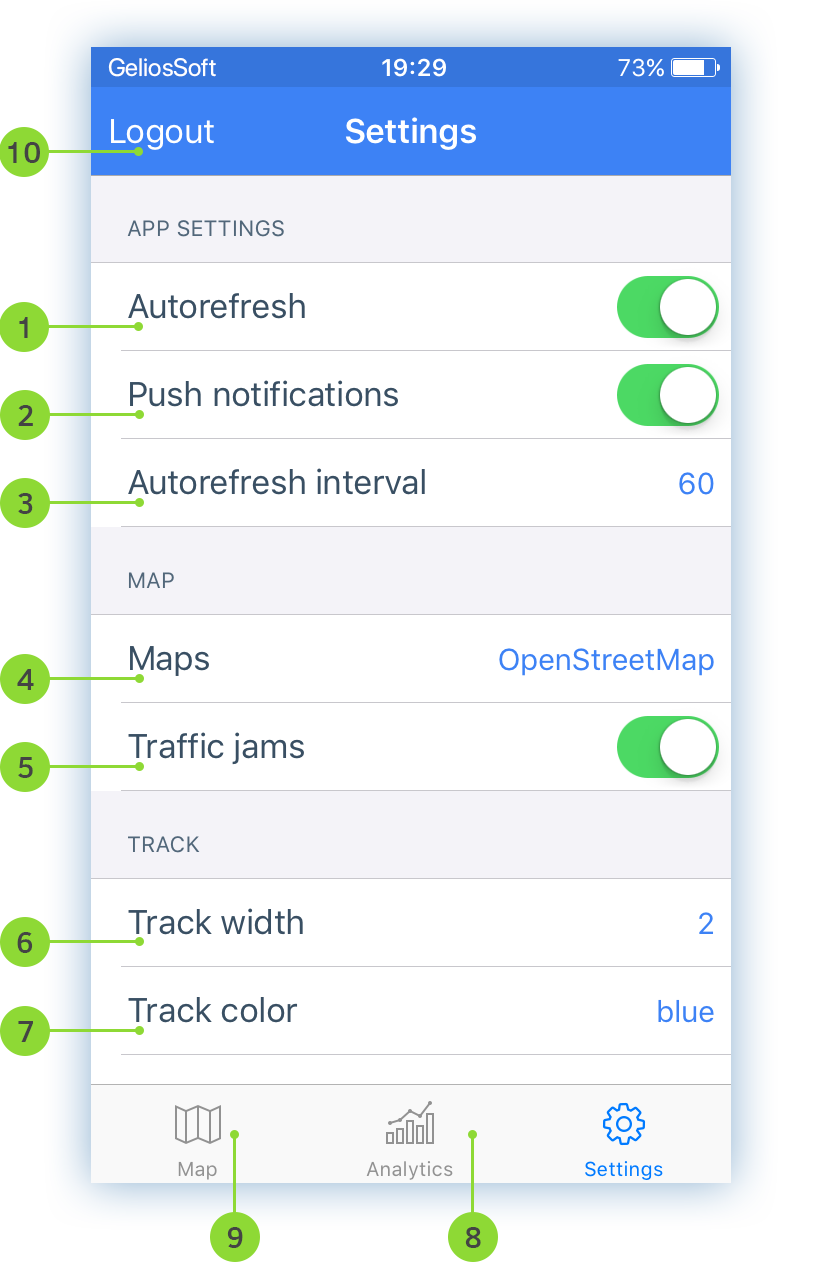
- Turn On / Off data autorefresh;
- Turn On / Off push-notifications;
- Set the autorefresh interval between 5 and 60 seconds;
- Choose map provider (OpenStreetMap, 2GIS, Visicom, Wikimapia, Google Hybrid, Google Standard, Google Satellite, Yandex Standard). Please note that visualisation of geofences and tracks is not available when using a Yandex map!;
- Turn On / Off traffic jams layer;
- Set a track thickness from 1 to 20 pixels;
- Select colour of the track (blue, red, brown, yellow);
- Go to the Analytics screen;
- Go to the Map screen;
- Account Logout;
3.2. Map
The Map screen is multifunctional. Here you can work with units, as well as with geofences.
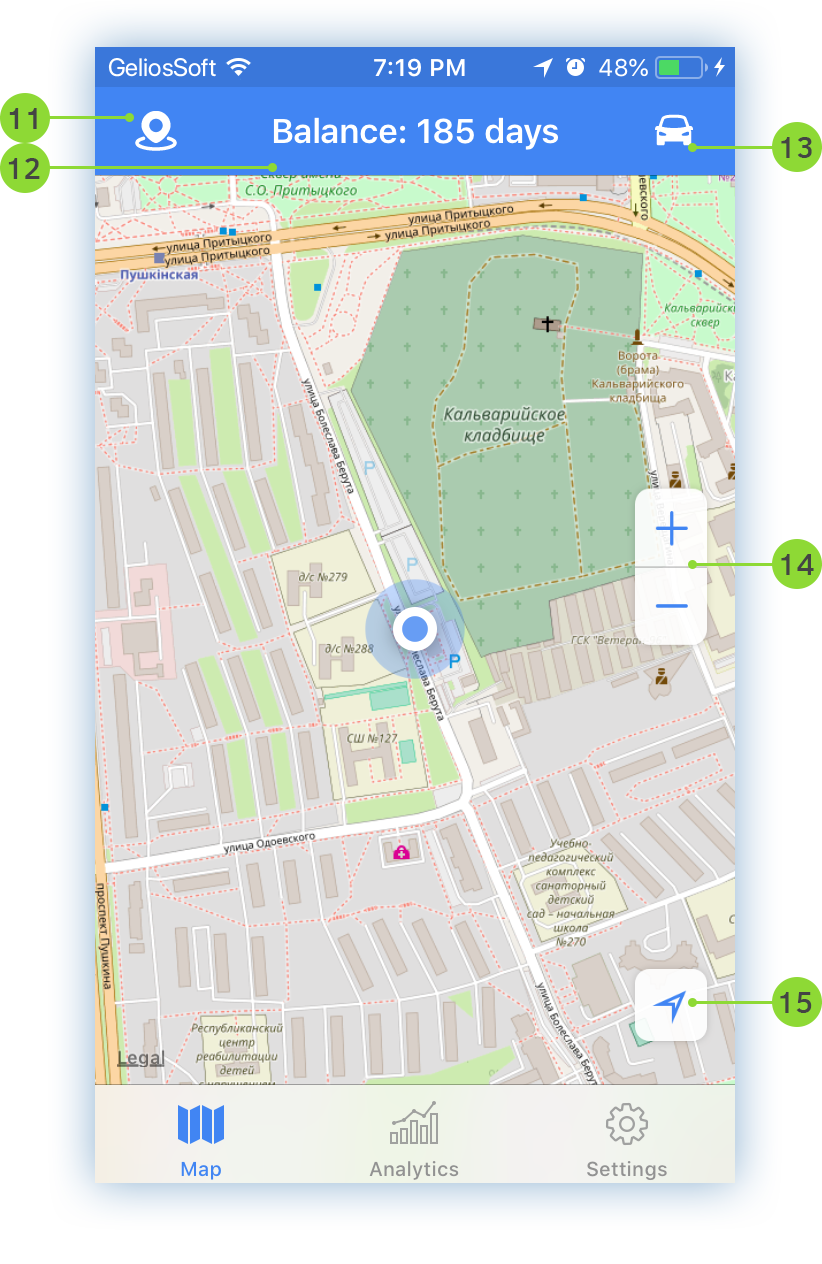
- Open list of geofences;
- User account balance;
- Open list of units;
- Changing the map scale;
- Focus on your current location (To display your current location on the map, allow the application access to the location);
3.2.1 Units
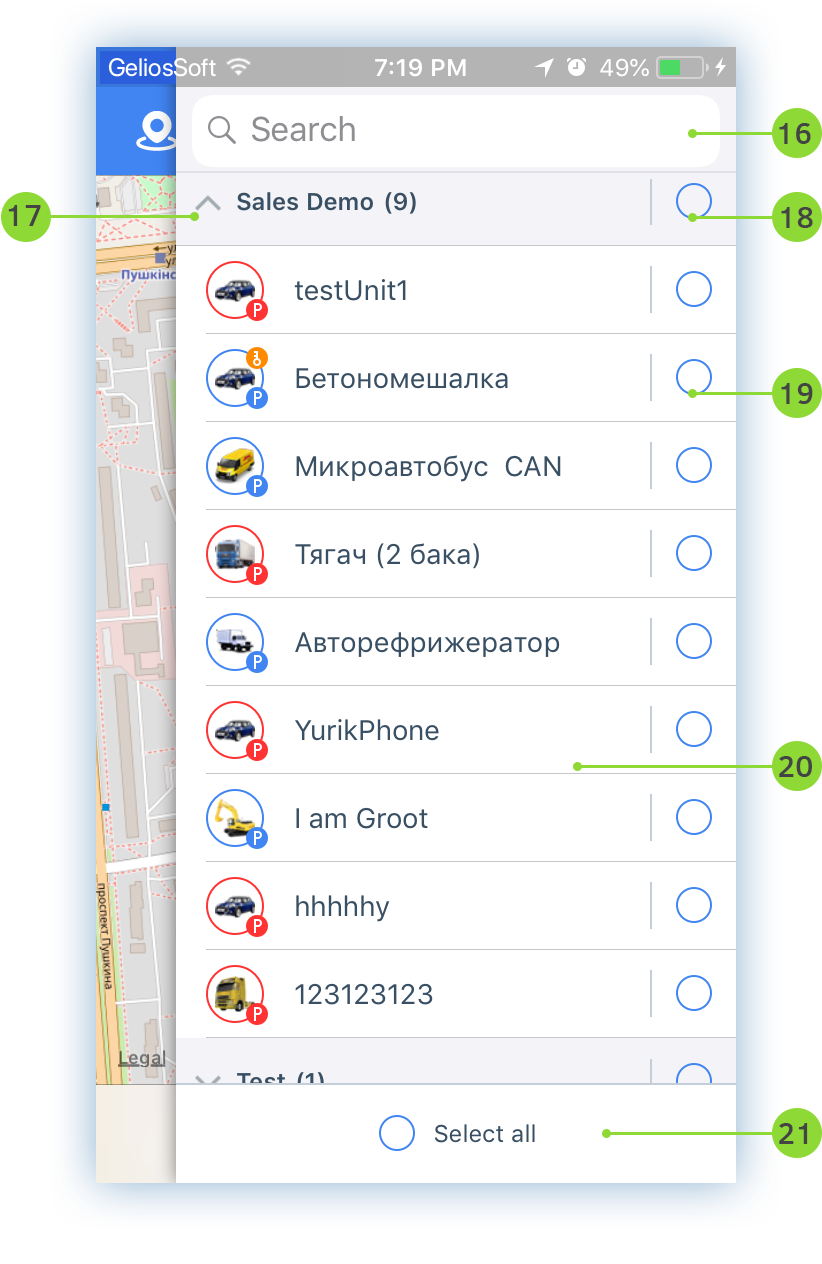
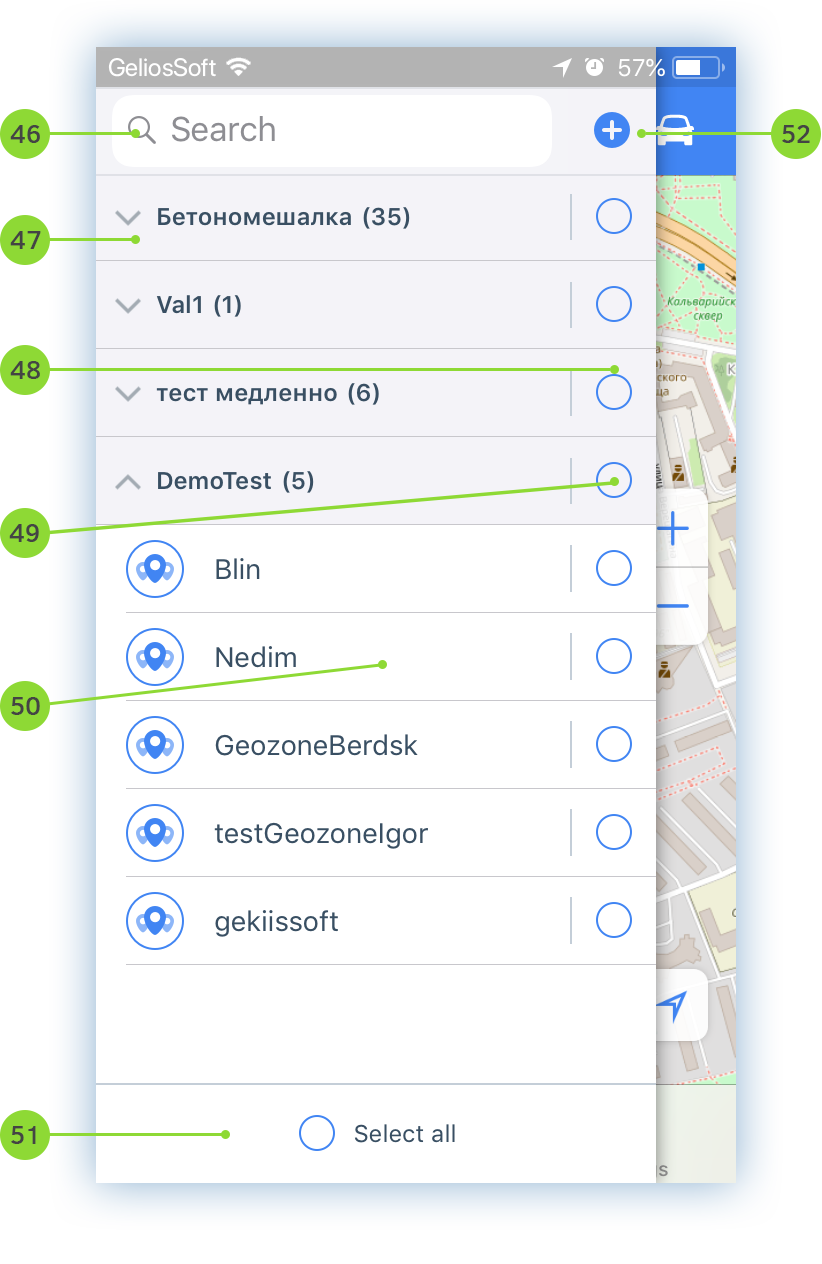
- Search for unit by name;
- Show / hide list of group's units;
- Display all group's units on map
- Select units to display them on the map;
- Tap on the unit name in the list to go to the unit on the map. You can track the movement of the unit taking into account the specified interval of autorefresh in the settings of the app;
- Select / Deselect all units to display on map;
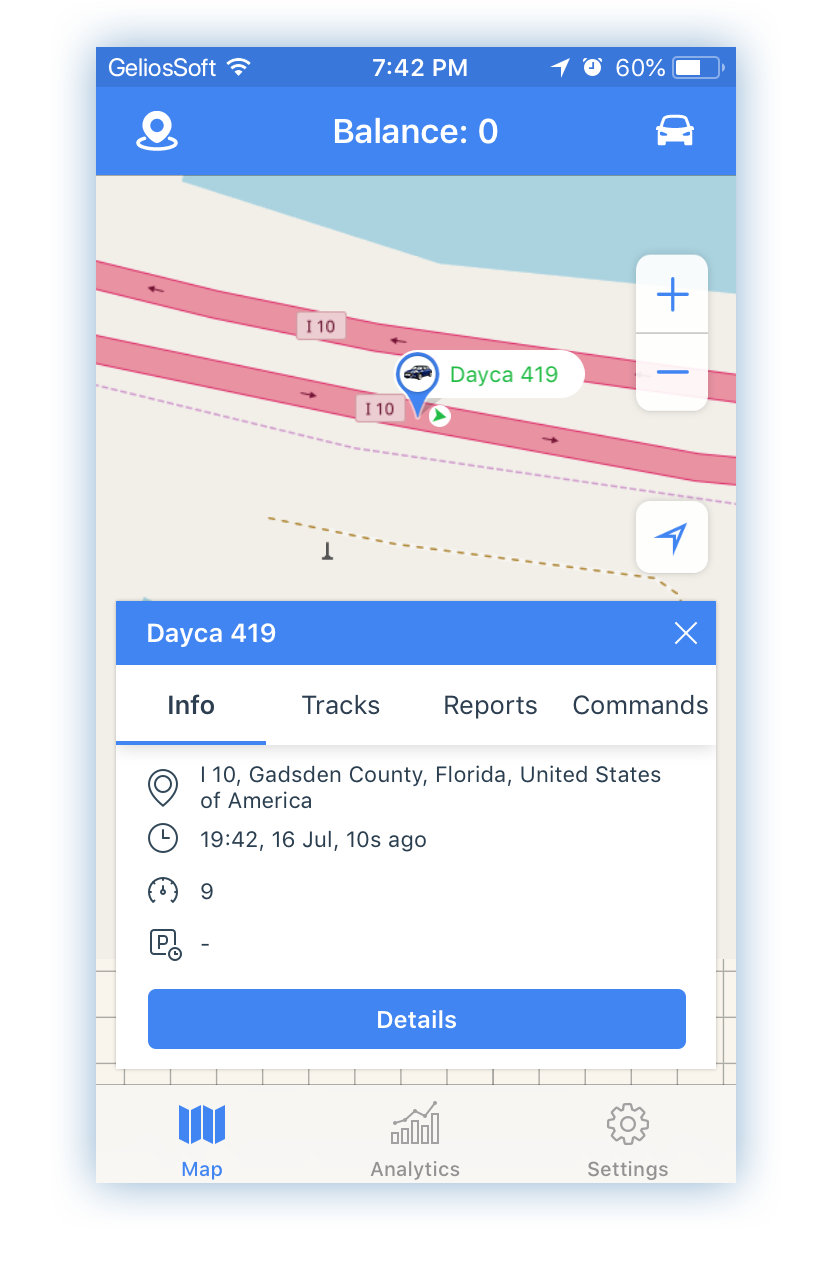
Tap on the unit icon on the map to start working with it. The menu of the unit with possibilities will be displayed on the screen: Get Unit information, Track building, Reports execution, Sending commands.
3.2.1.1. Unit Information
To get detailed information about the unit click on "Details"
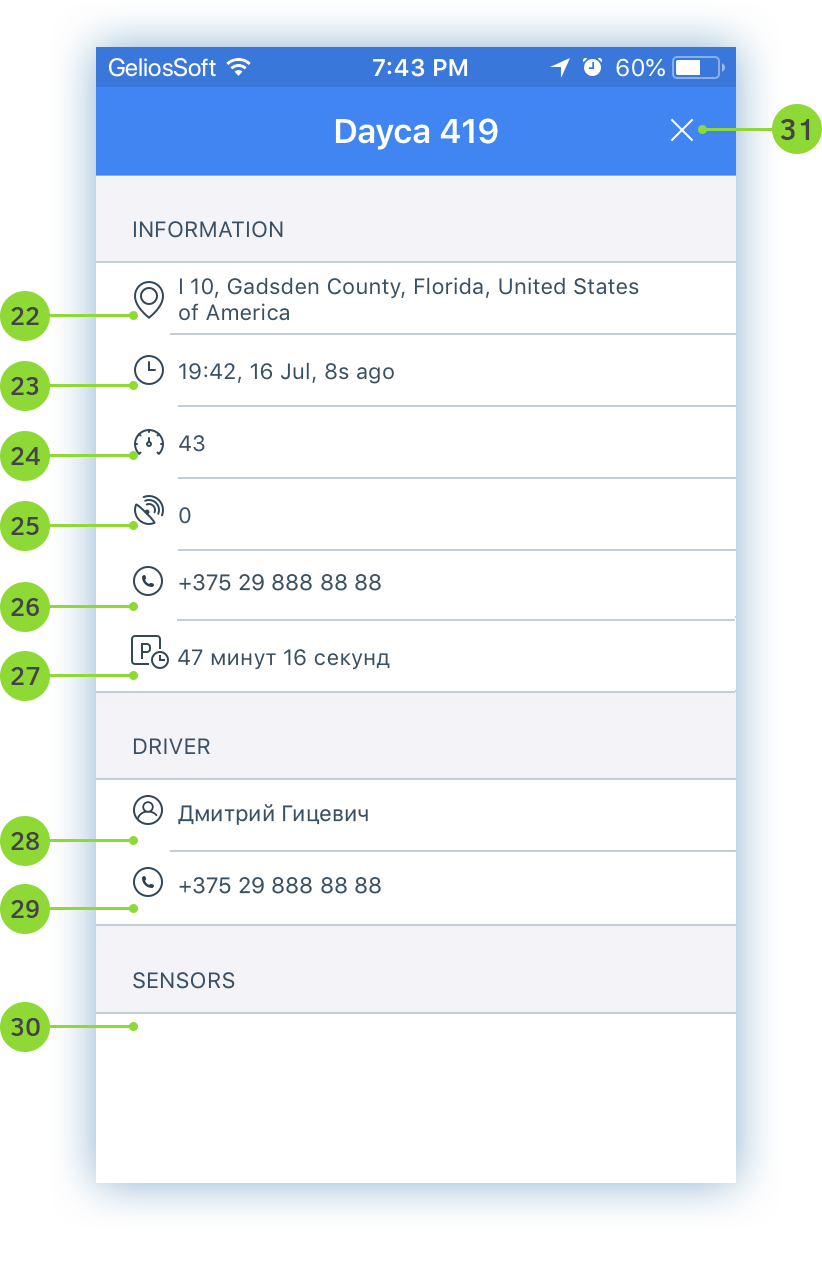
- Address of the current location of the unit;
- Date and time of the last message;
- Current speed;
- Number of satellites;
- Сontact phone number;
- Duration of Parkings/Stops;
- Driver name;
- Driver's phone number;
- Sensors: readings of all connected sensors will be displayed in this field;
- Hide detailed information about the unit;
3.2.1.2. Track
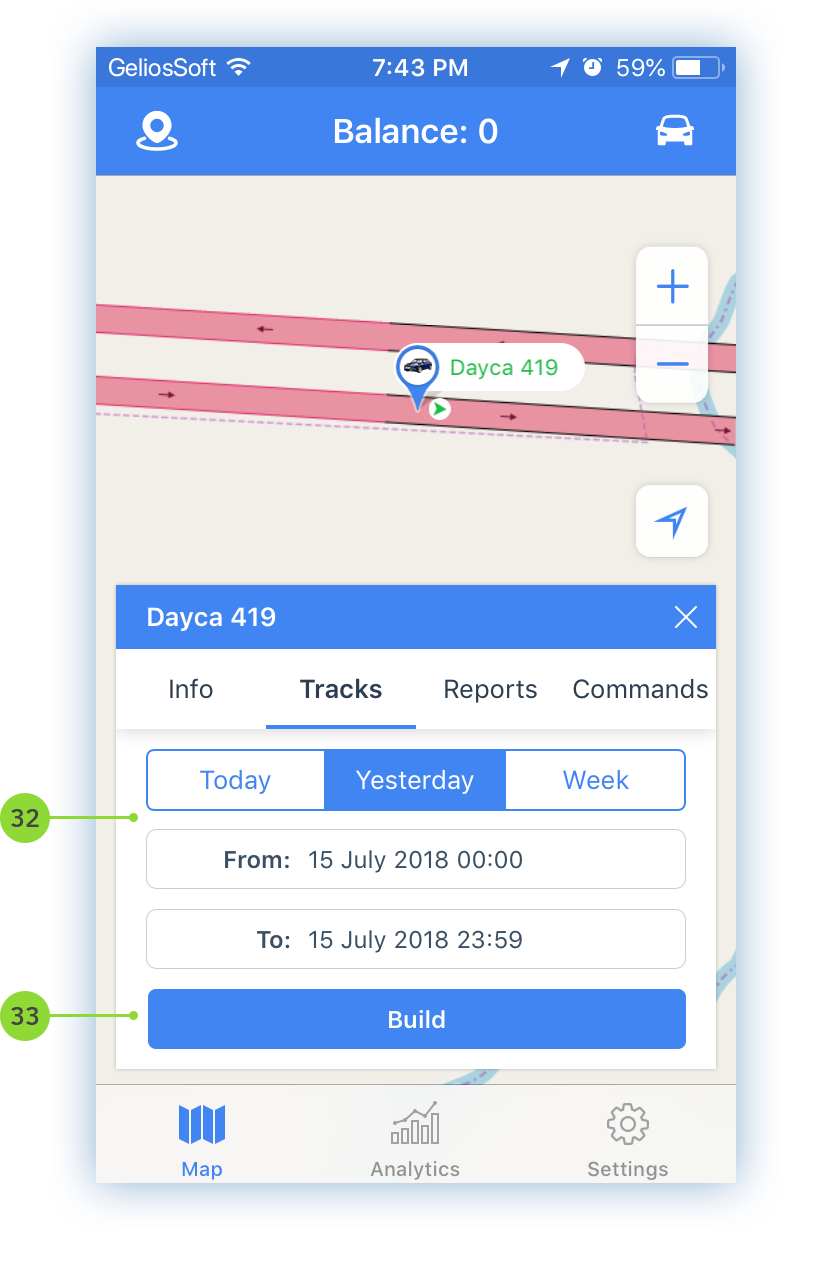
- Select the time period for which you want to build a track. Use fast interval selection with the buttons: «Today», «Yesterday», «Week», or select your own interval;
- After interval selection click on «Build»;
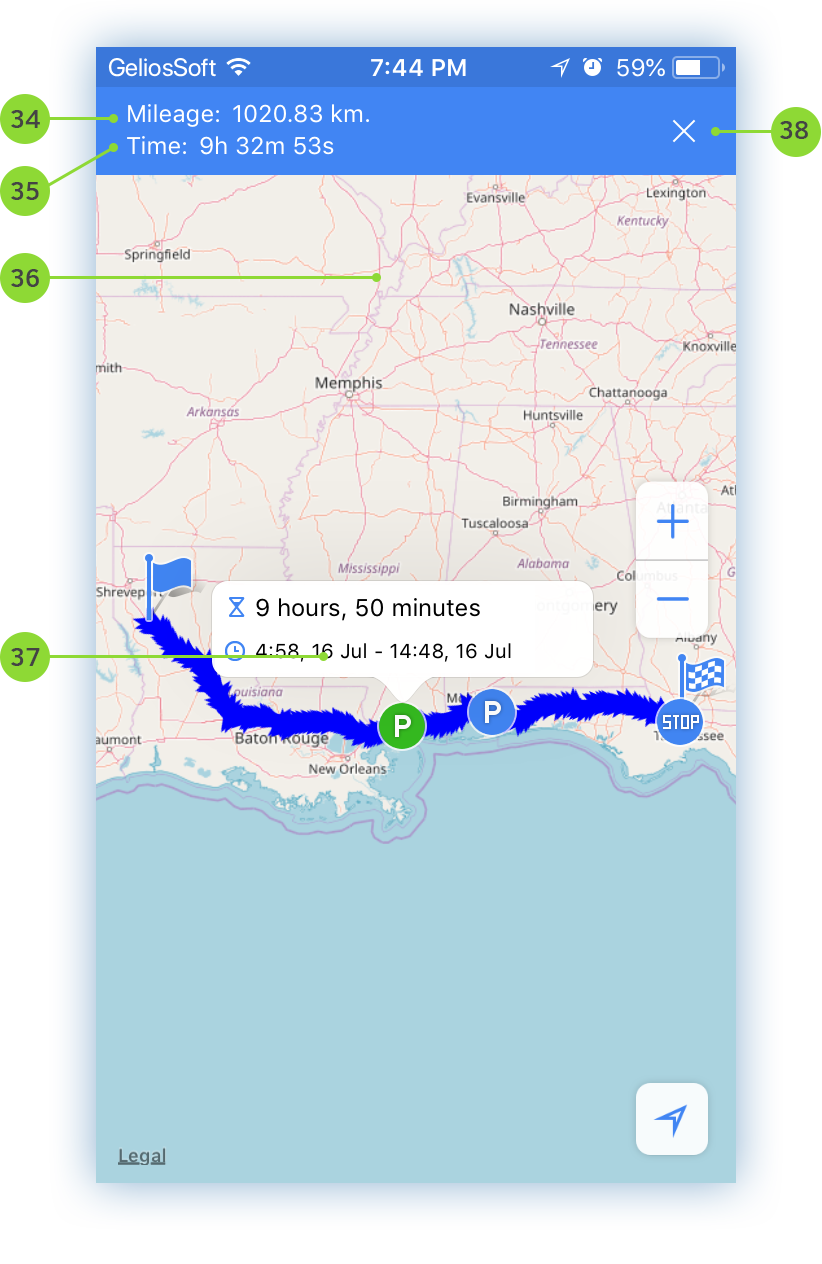
The map shows the track, which indicates: the beginning of the track, the end of the track, parkings and stops.
- Mileage;
- Duration time;
- Click on the parking icon to get the date, time and duration of the parking;
- Click on the parking icon to get the date, time and duration of the stop;
- Hide map with track;
3.2.1.3. Report
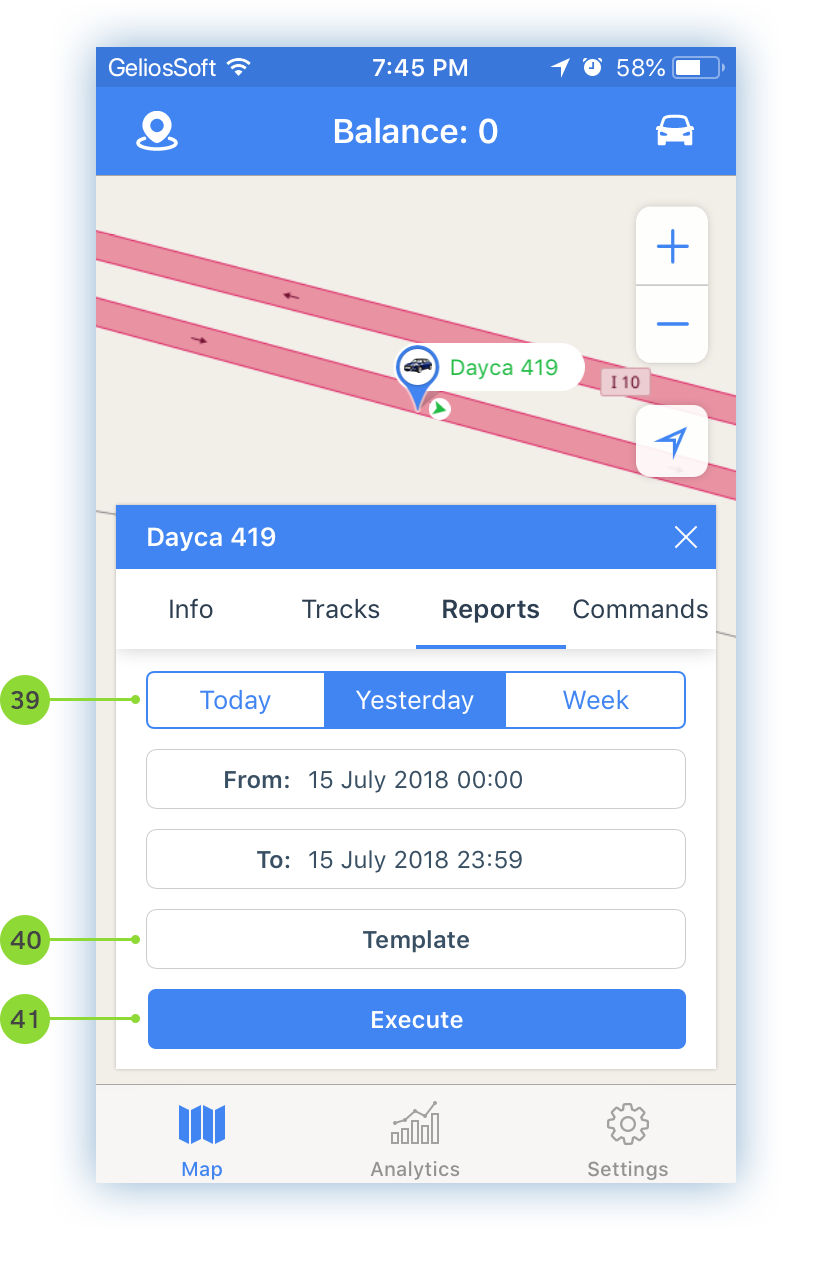
- Select the time period for which you want to execute report. Use fast interval selection with the buttons: «Today», «Yesterday», «Week», or select your own interval;
- Select pattern of report;
- Click on «Execute». The report will be in PDF format. You can also send it by email after the report is completed;
3.2.1.4. Command
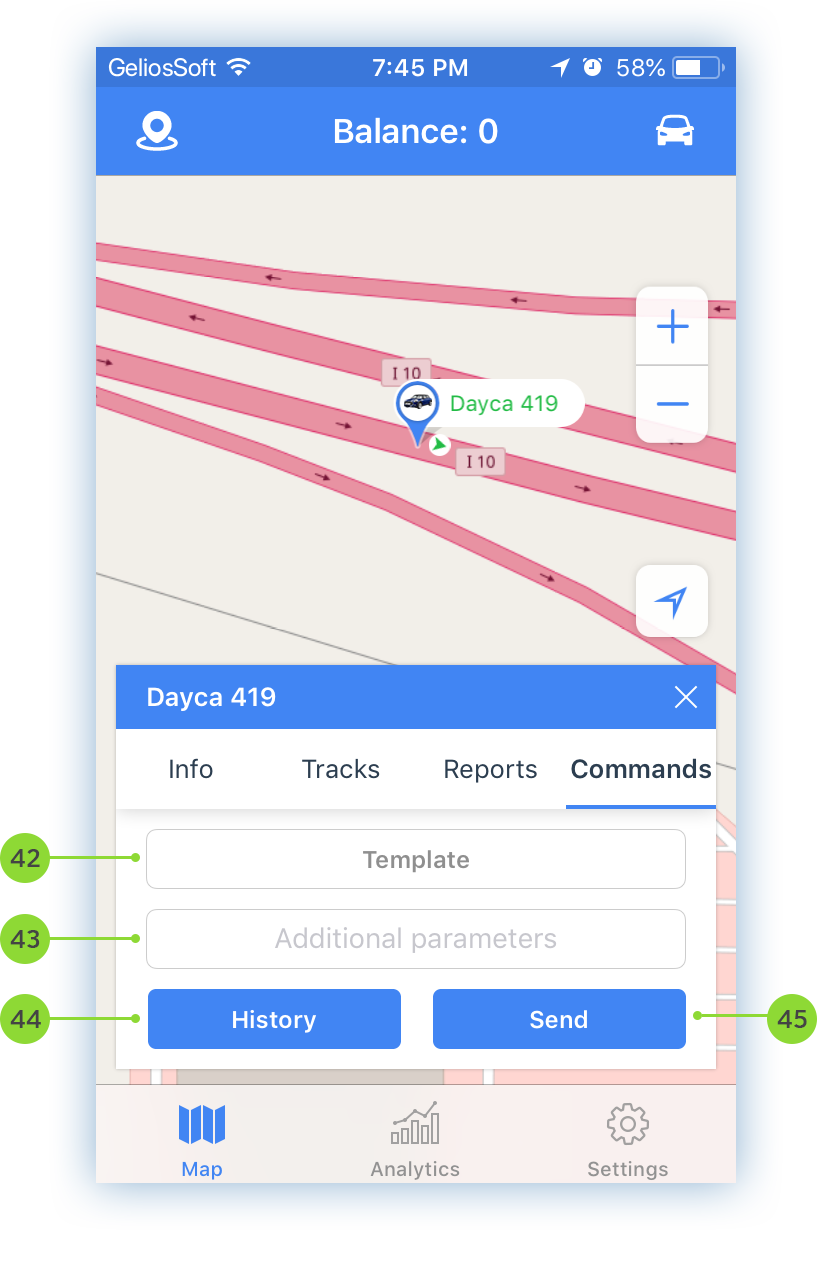
- Select pattern of command;
- Enter additional parameters;
- Command history
- Click on «Send»;
3.2.2 Geofences
- Search for geofences by name;
- Show / hide list of group's geofences;
- Display all group's units on map
- Select geofences to display them on map;
- Tap on a geofence name in the list to go to the geofence on the map;
- Select / Deselect all geofences to display them on the map;
- Create new geofence;
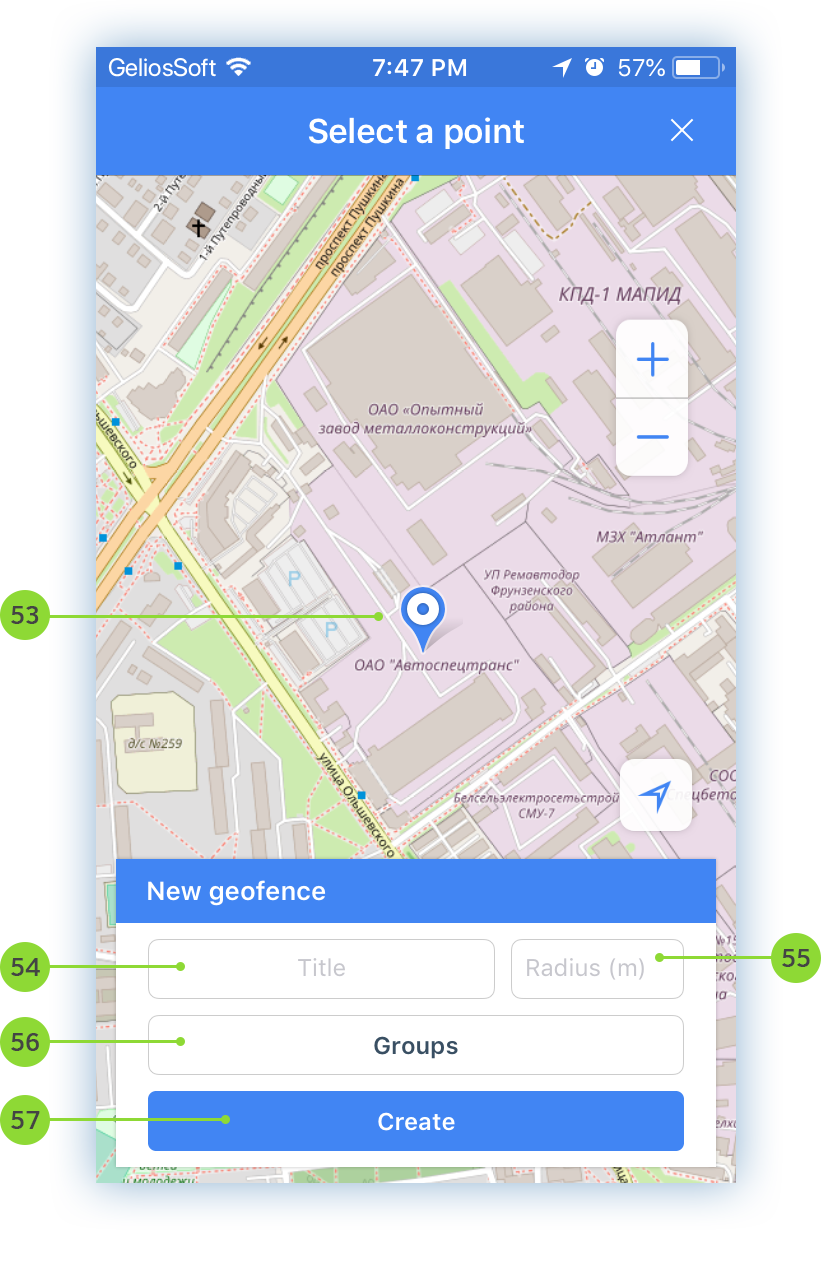
- Choose a point on the map to create new geofence;
- Enter name of geofence;
- Enter radius of geofence in meters;
- Select a group for geofence;
- Click on «Create»;
Tap on the geofence icon on the map to start working with it. The menu of the geofence with possibilities will be displayed on the screen: Get geofence information, Creation of notification on geofence control.
3.2.2.1. Geofence Info
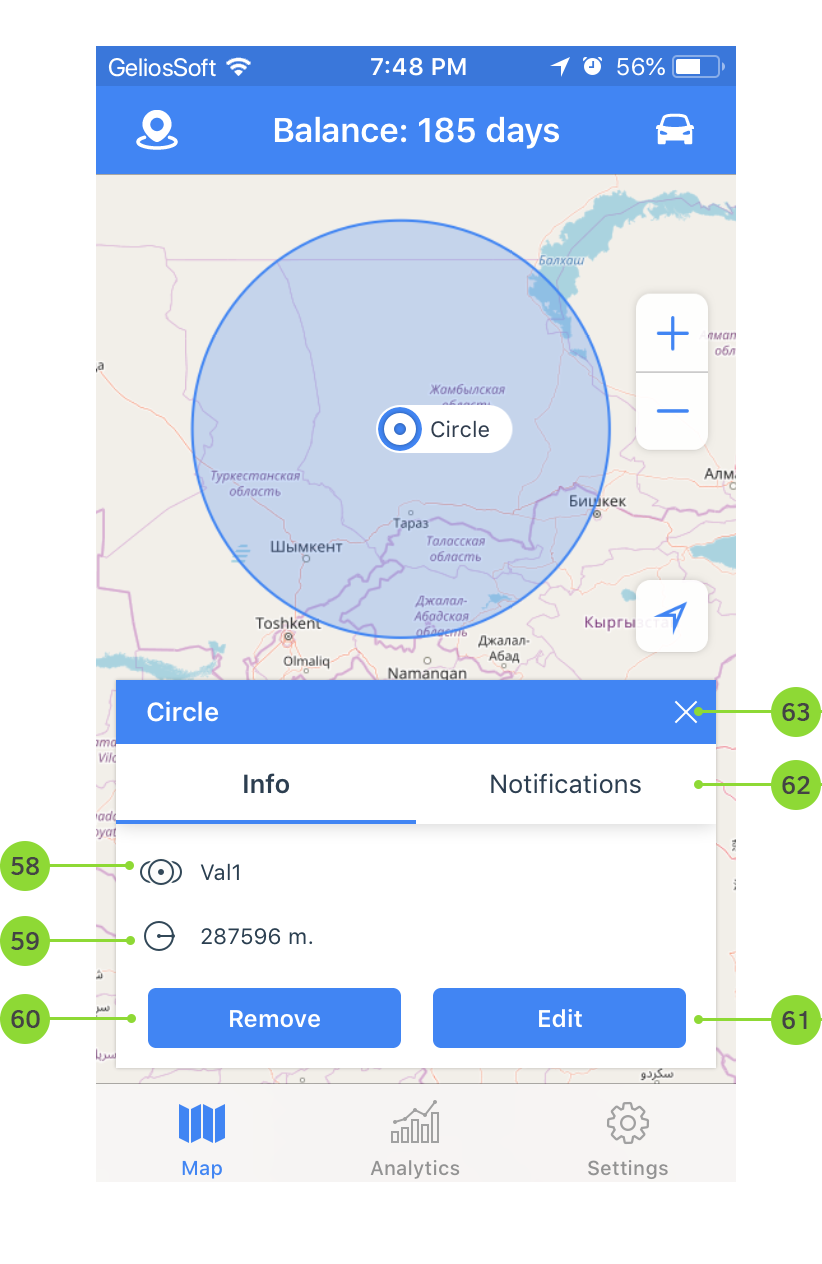
- Name of the geofence groups to which the given geofence belongs;
- Geofence radius;
- Remove geofence;
- Edit geofence;
- Go to the notification on geofence control;
- Close geofence menu.
3.2.2.2. Notification on Geofence Control
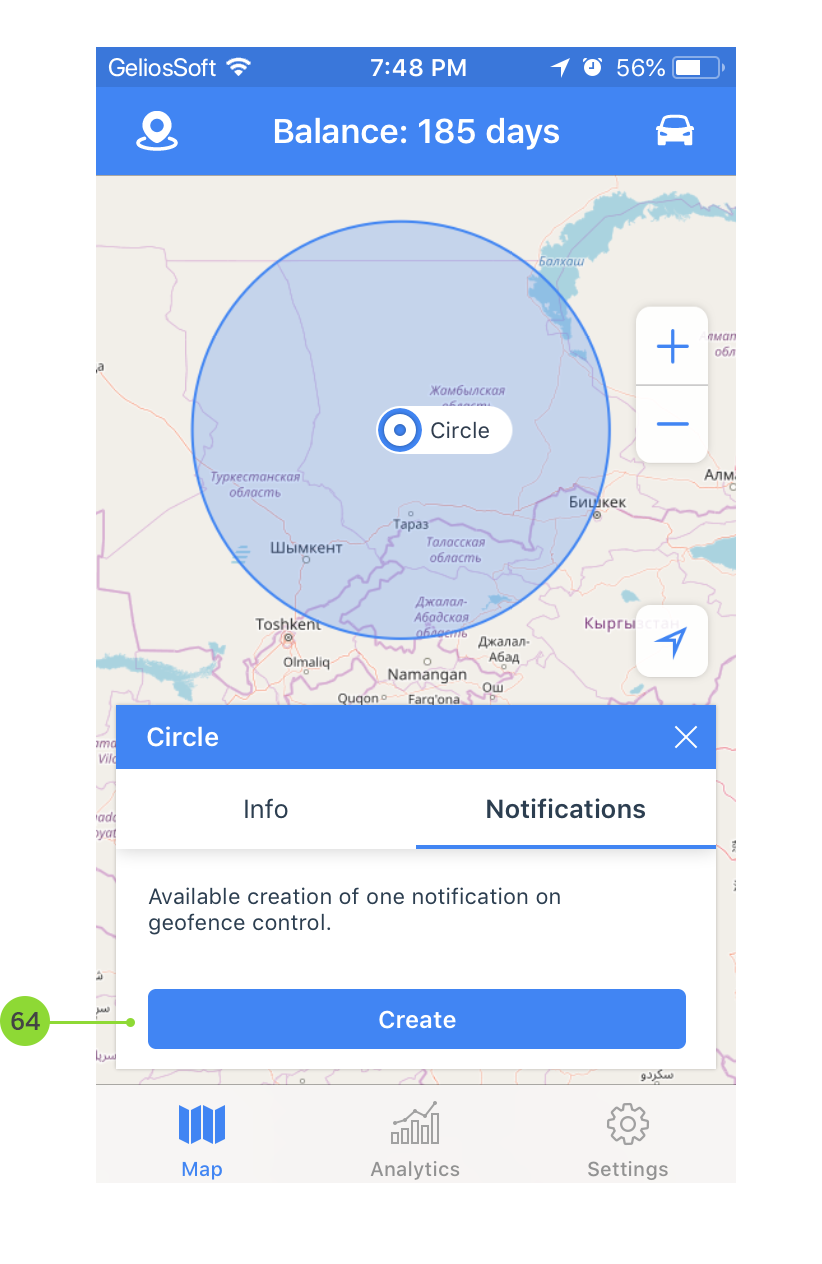
- Available creation of one notification on geofence control. Click "Create" to start creation a notification on geofence control
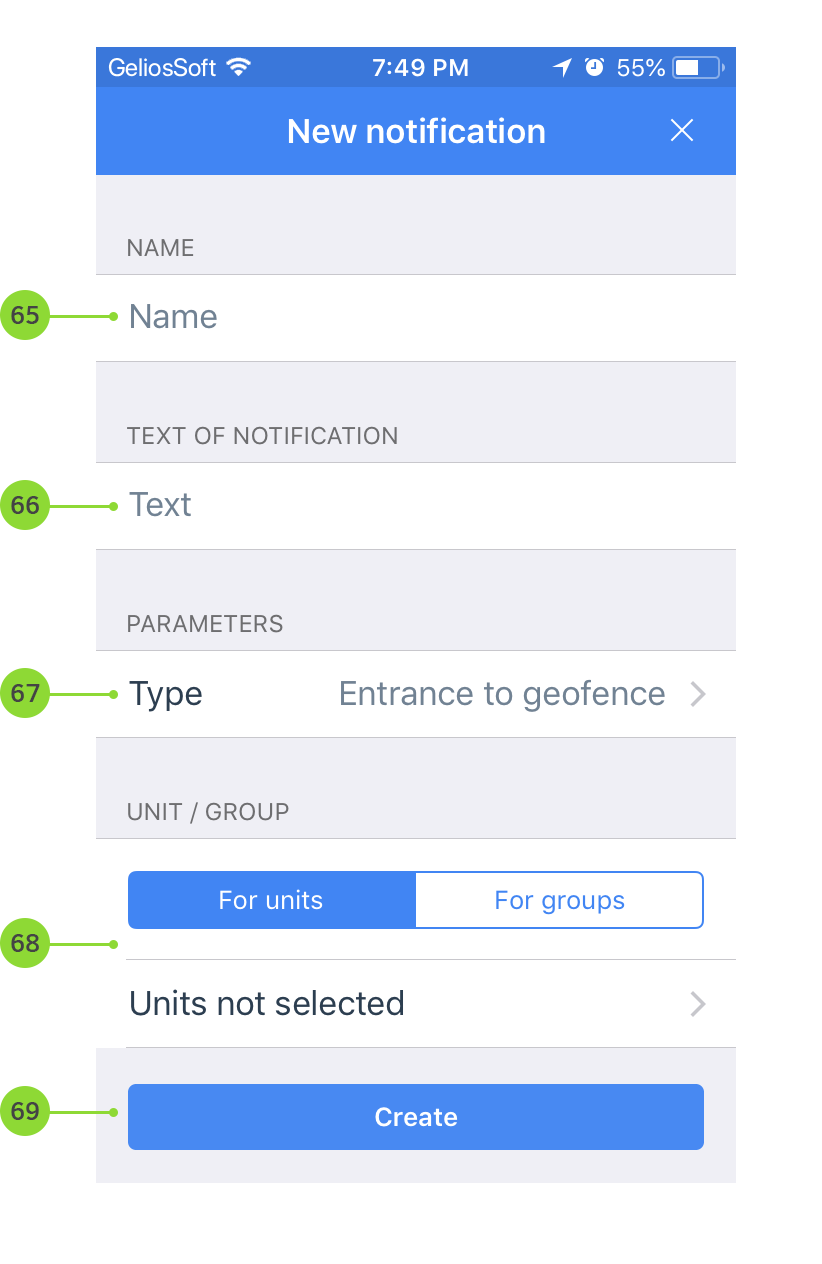
- Enter notification name;
- Enter notofocation text (Attention! When creating notification for entrance and exit the geofence, the notification text is generated automatically);
- Choose notification type;
- Select units or groups of units;
- Click "Create"
3.3. Analytics
Analytics screen includes: Reports, Notifications log, Graphs, Assessment of driving quality
3.3.1 Reports
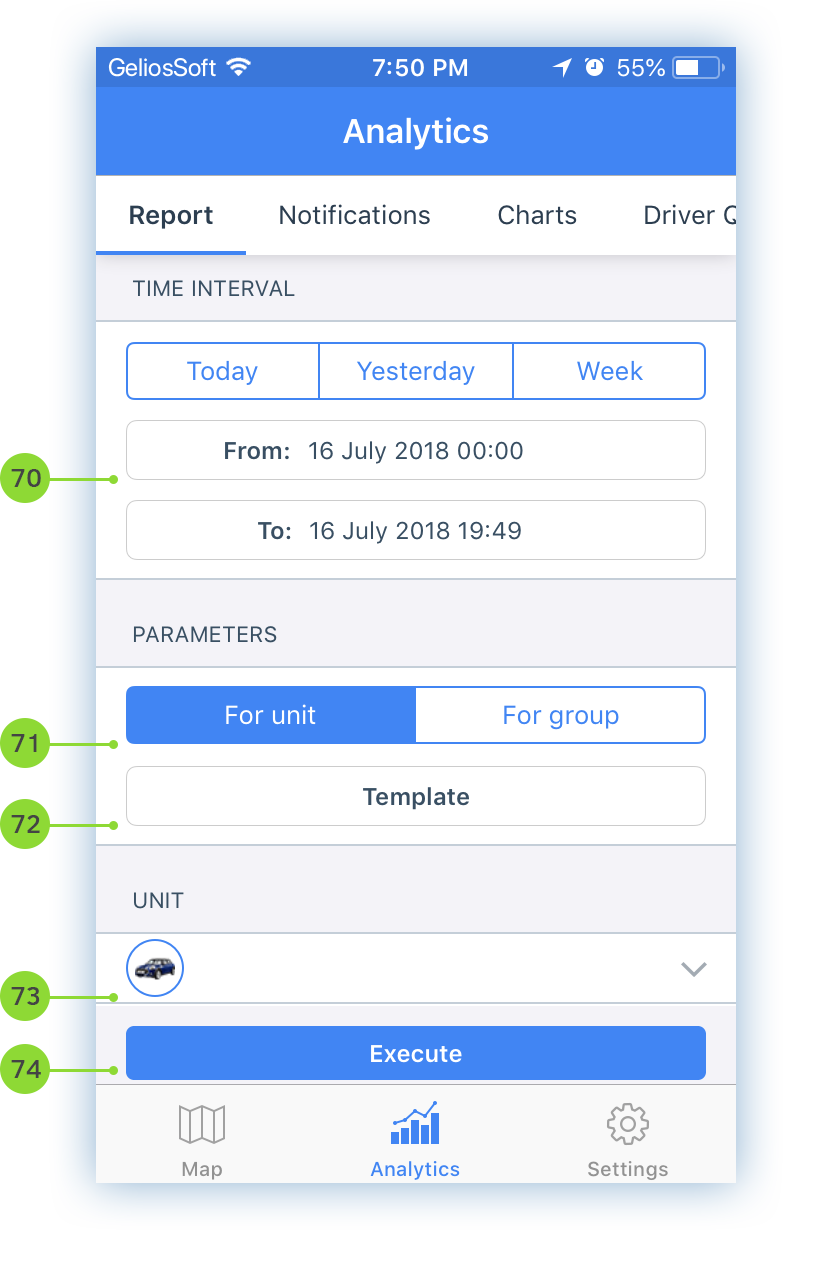
- Select the time period for which you want to execute report. Use fast interval selection with the buttons: «Today», «Yesterday», «Week», or select your own interval;
- Select report by type: «For Unit» or «For Group»;
- Choose pattern of report;
- Select unit or group of unit depending on the report type;
- Click on «Execute». The report will be in PDF format. You can also send it by email after the report is completed;
3.3.2 Notifications
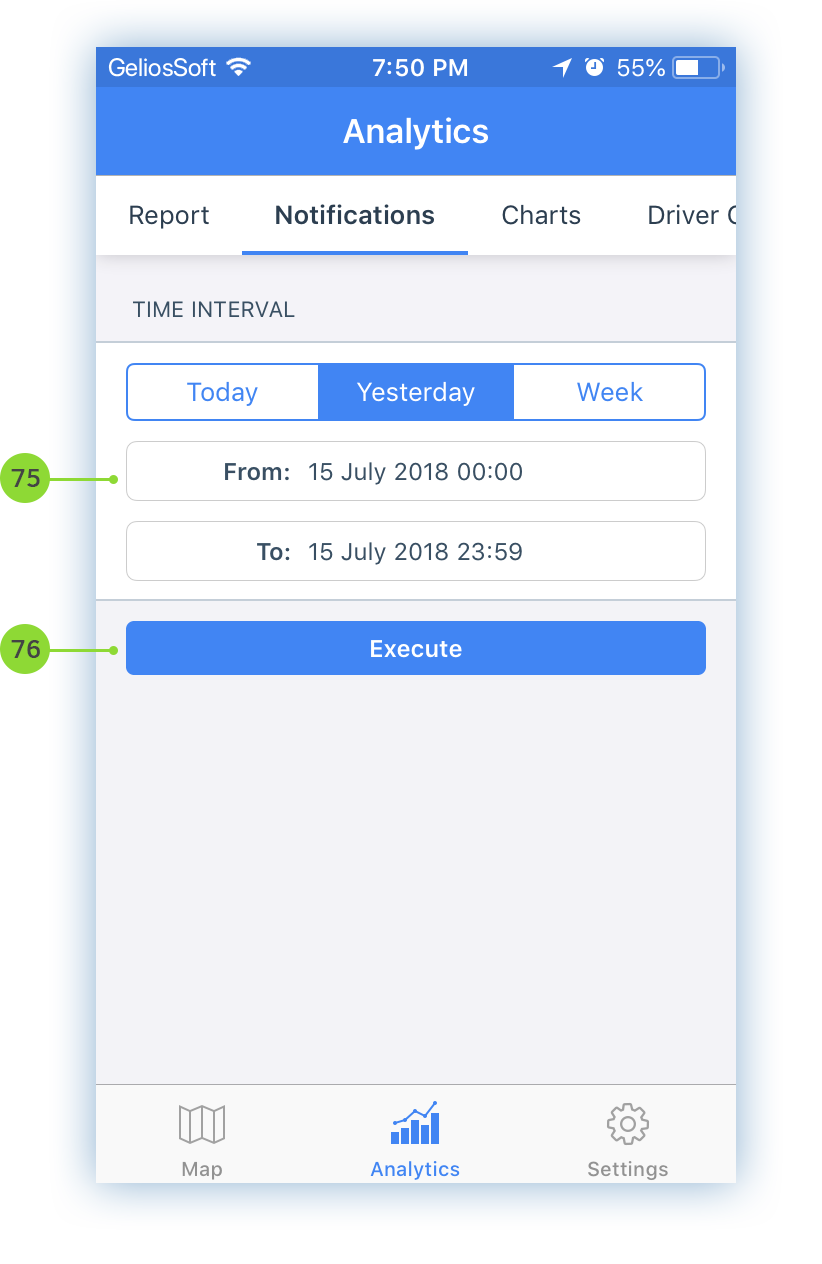
- Select the time period for which you want to get list of notifications. Use fast interval selection with the buttons: «Today», «Yesterday», «Week», or select your own interval;
- Click on «Execute»;
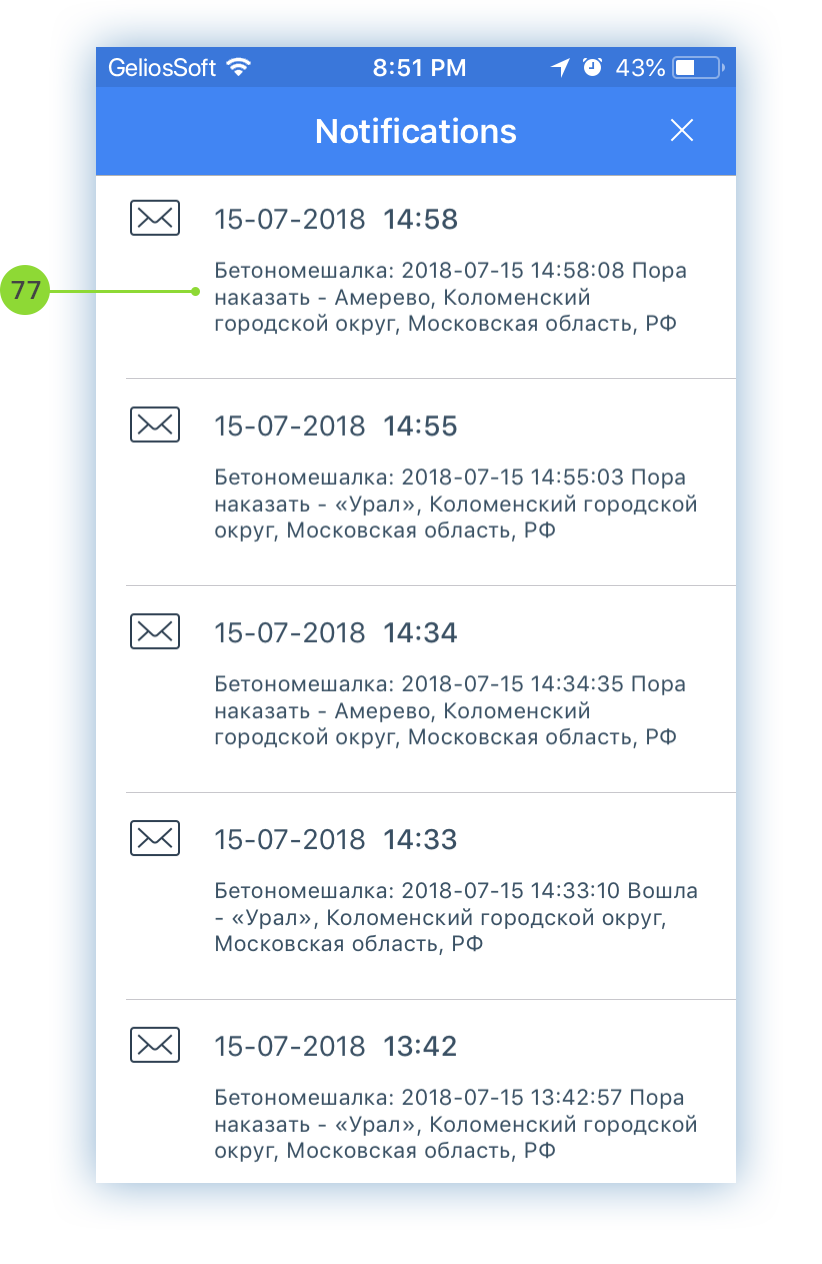
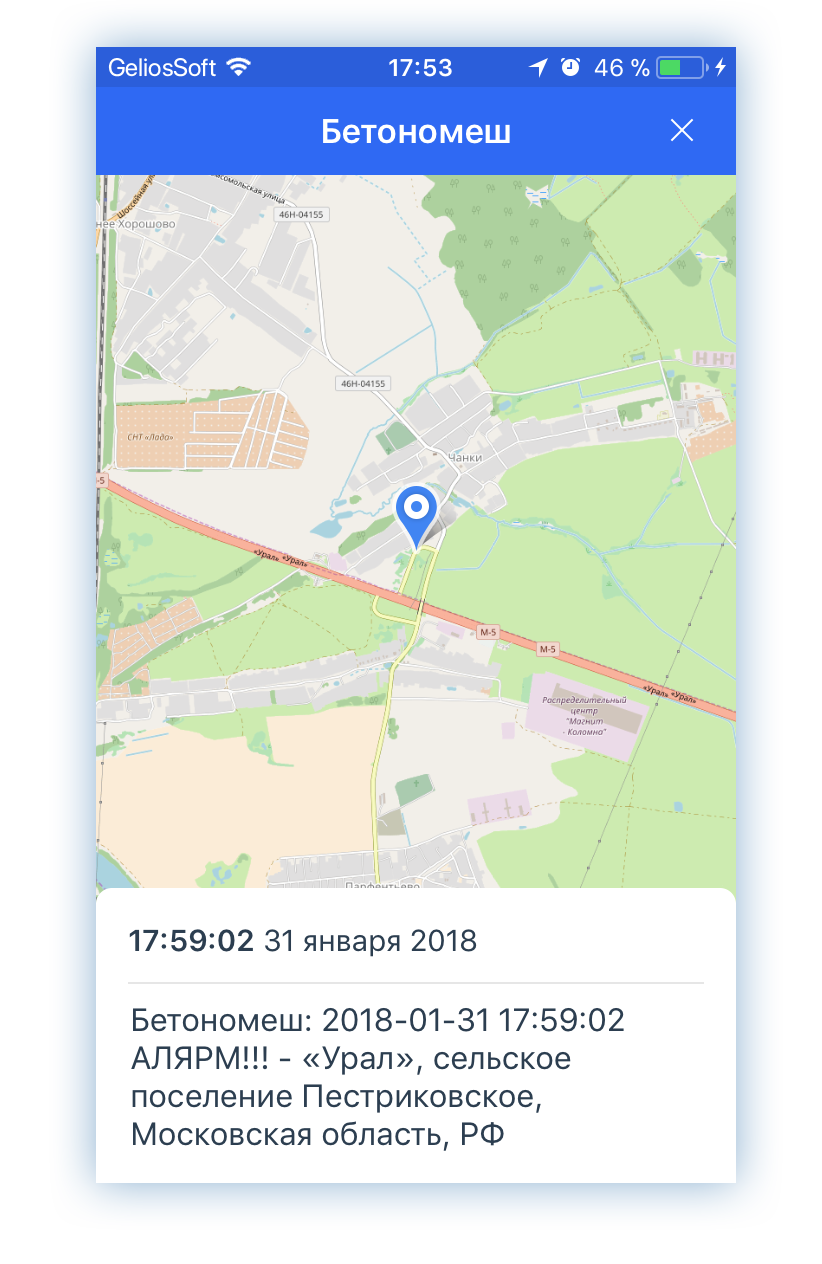
- Tap on notification to see the place of triggered notification on map
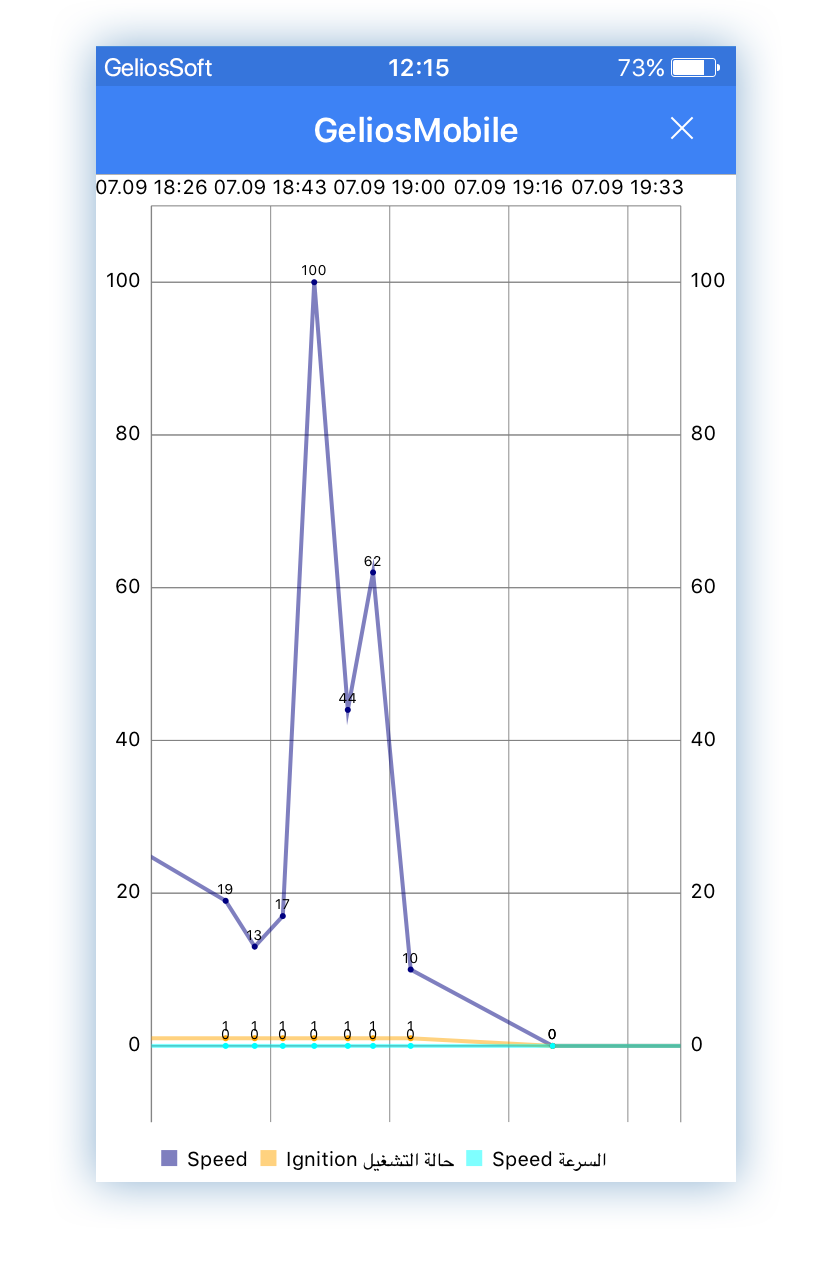
3.3.3 Graphs
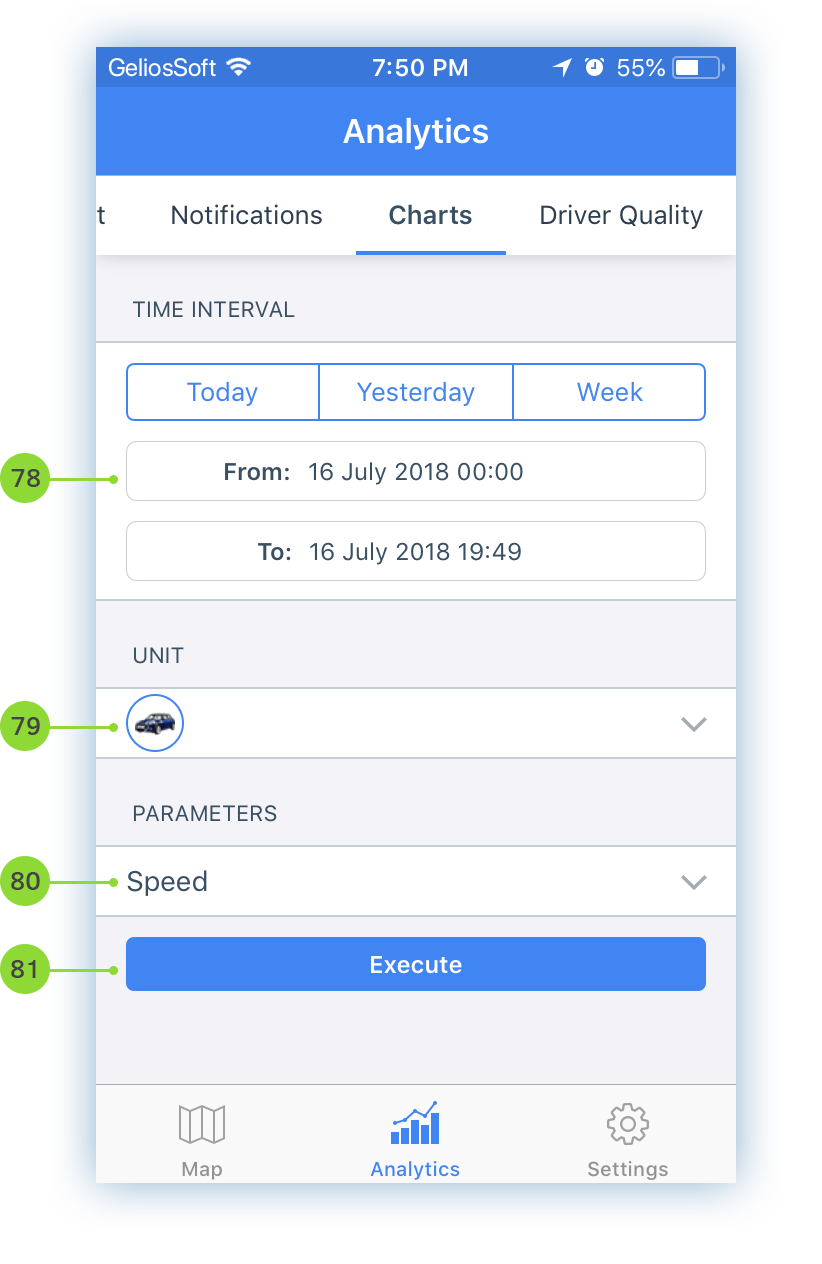
- Select the time period for which you want to build a graph. Use fast interval selection with the buttons: «Today», «Yesterday», «Week», or select your own interval;
- Select unit;
- Select the parameters you want to display on the graph;
- Click on «Execute»;
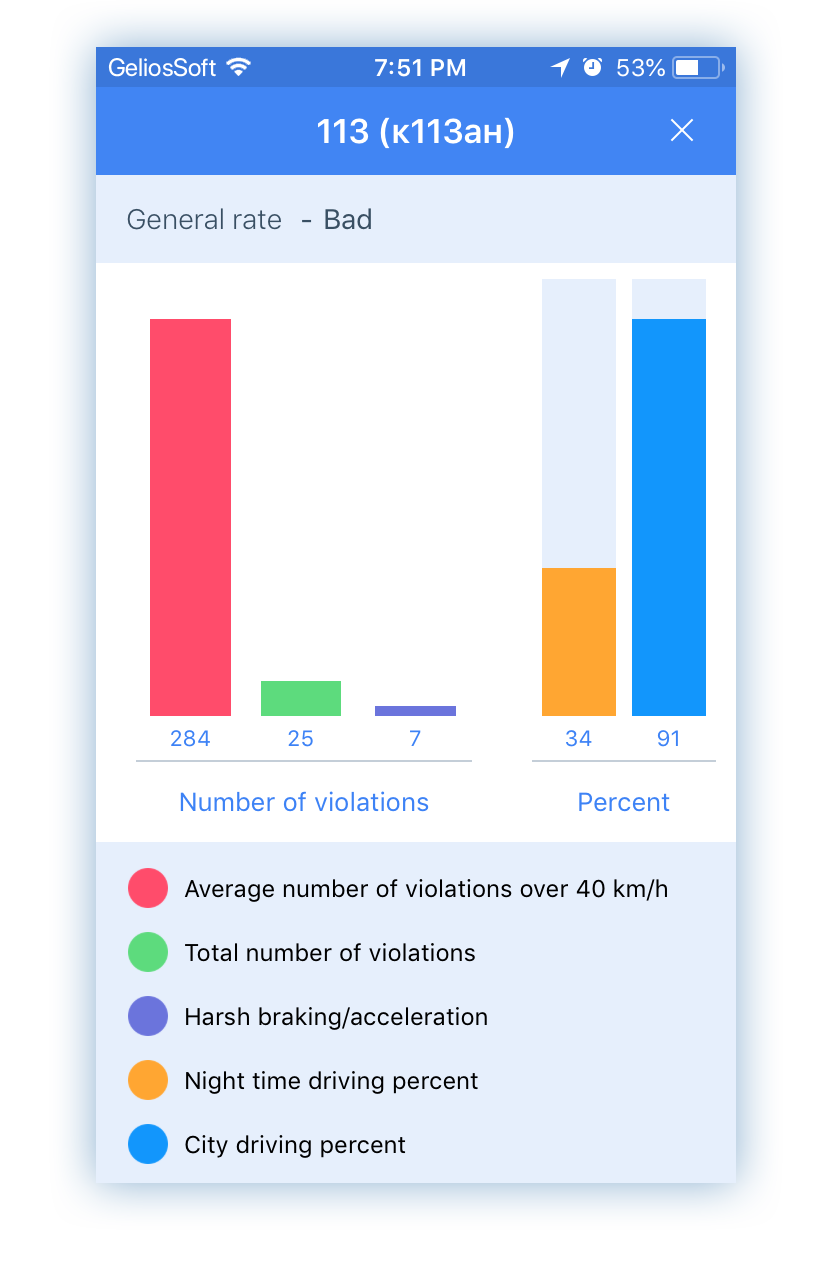
3.3.4 Driver Quality
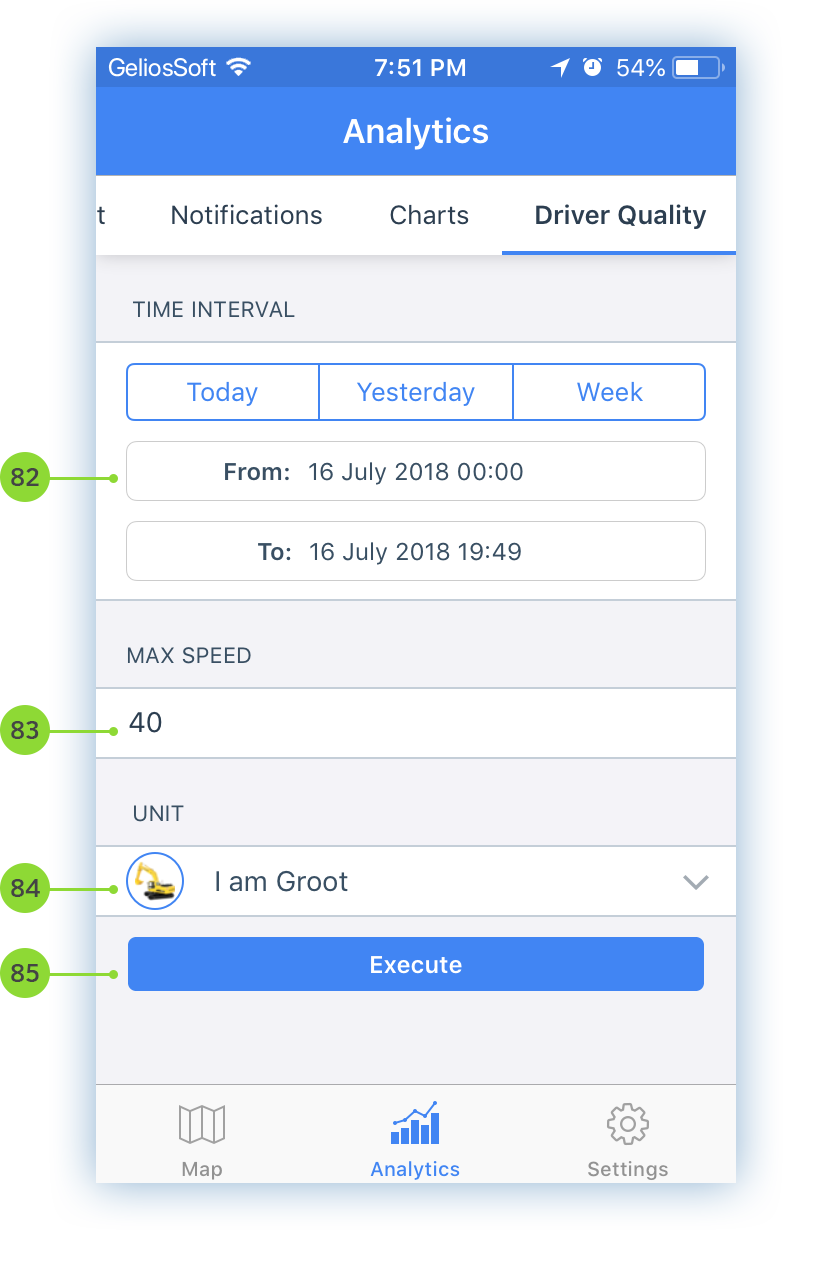
- Select the time period for which you want to analyze driver quality. Use fast interval selection with the buttons: «Today», «Yesterday», «Week», or select your own interval;
- Specify maximum speed for unit
- Select unit;
- Click on «Execute»;
If you have any questions, please contact technical support: support@geliossoft.ru
More detailed information you can find in our documentation
Follow Us on Social Networks:
Official website: www.GeliosSoft.com