Statistics
Statistics displays the tree of child users with the number of units they own.
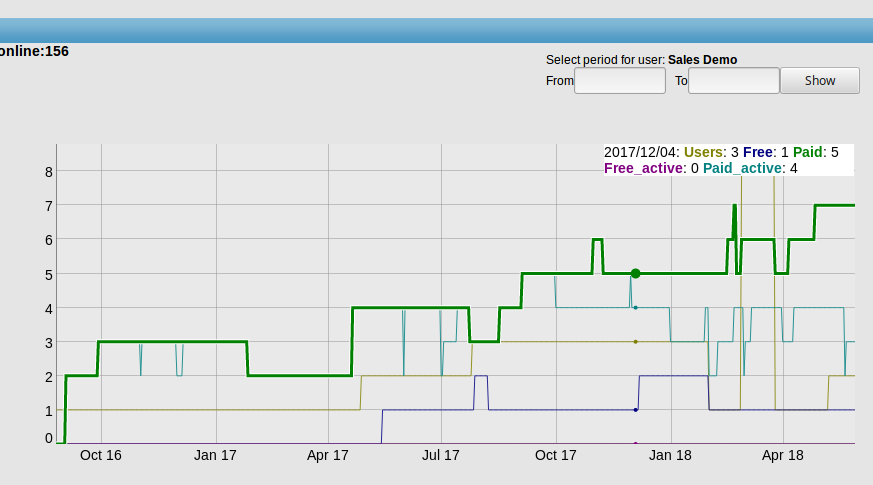
A click on the icon ![]() opens the graph with the main statistics of the selected user on the right side of the screen. The graph displays information on the number of paid/free units, paid/free active units and the number of subsidiaries for a period of time. Above the graph there is a filter, which selects the time interval within which the chart and table are plotted.
opens the graph with the main statistics of the selected user on the right side of the screen. The graph displays information on the number of paid/free units, paid/free active units and the number of subsidiaries for a period of time. Above the graph there is a filter, which selects the time interval within which the chart and table are plotted.
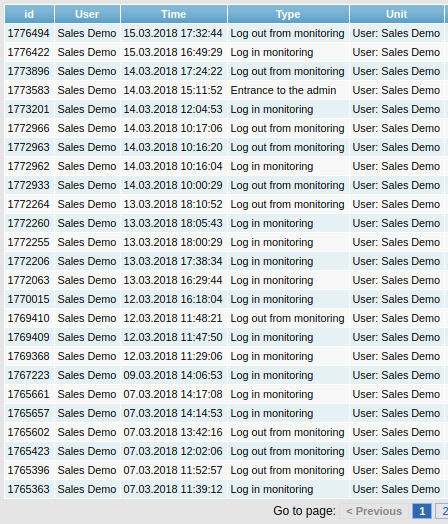
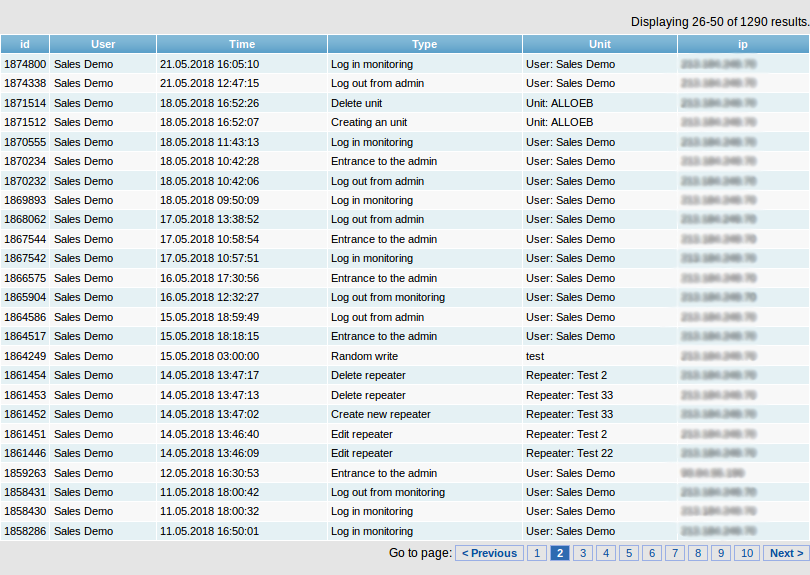
Below the graph there is a table that stores the user's activity history. The table contains information about:
- ID - Action ID
- User - the name of the account under which the action was performed
- Time - indicates the date and time in which the action was taken
- Type - type of the action performed
- Unit - the unit on which the action was performed
- IP - the IP address used for performing the action