Driving Quality Assessment
The report Driving Quality Assessment displays the violations committed by the driver and leads to the conclusion about the driving quality.
The following list of violations affecting the driving quality assessment is provided:
- Exceeding the specified speed;
- Dangerous maneuvering – 90 degree or more turn at a speed of more than 20 km/h;
- Hard acceleration – speed increase from a speed of less than 120 km/h by 20 km/h, provided that the speed of the object exceeded 120 km/h in a short period of time;
- Hard braking – reduction of the speed by 20 km/h in a short period of time.
The list of report filters is unfolded in the workspace of the window when you click icon ![]() .
.
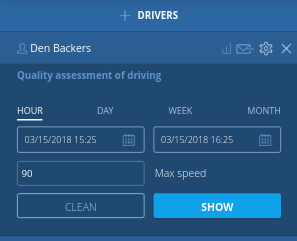
To create a track report, you must specify a time interval. Standard intervals of the system are:
- Last hour (by default);
- Last day;
- Last week;
- Last month.
Next, you need to specify the maximum allowable speed for this driver.
To generate a report, click the Show button.
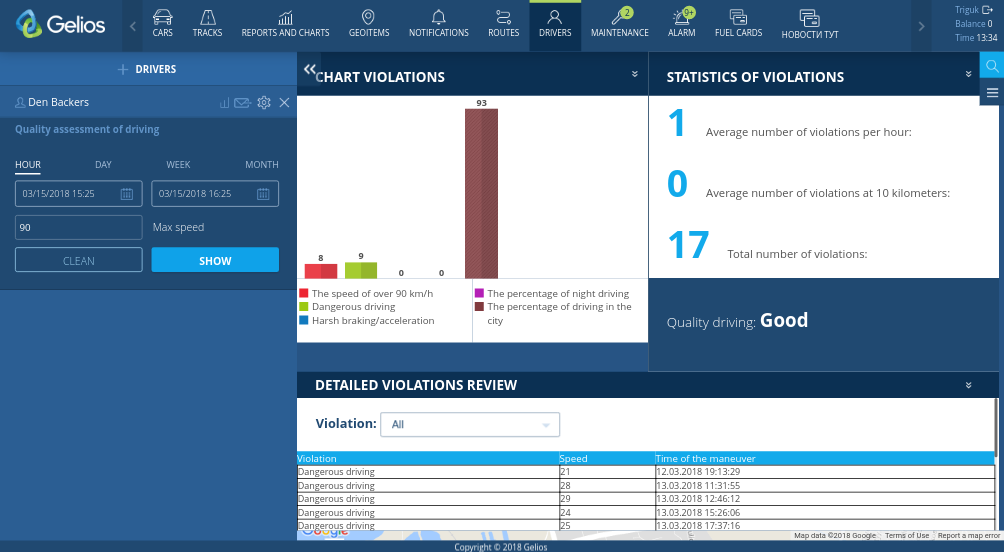
At the top of the report, there is a diagram showing the number of violations filtered by type, as well as the percentage of night and city driving.
Statistics of violations consists of:
- Average number of violations per hour;
- Average number of violations per 10 kilometers;
- Total number of violations.
A list of violations is provided at the bottom of the report. The Violation filter is provided for filtering the list by type of violation.
By clicking on a line, the point at which the violation was committed will be displayed on the map.